


Nanoplastics in Antarctic Soil: Why Environmental Testing Must Look Below the Visible
Nanoplastics in Antarctic Soil: Why Environmental Testing Must Look Below the Visible
Scientists have detected nanoplastics in soils from one of Antarctica’s most remote ice-free environments.
The particles were found in the McMurdo Dry Valleys, where extremely cold, dry and nutrient-poor conditions have historically made the region an important reference environment for scientific research.
The discovery demonstrates how far plastic contamination may extend. More importantly for environmental monitoring, it shows how much can remain undetected when conventional analytical methods cannot examine particles at the nanoscale.
The study does not prove that all Antarctic soils are contaminated at similar concentrations. It does not conclusively identify where each polymer originated, and it did not demonstrate ecological damage.
Its principal contribution is an analytical and environmental baseline: evidence that selected plastic materials can be detected in Antarctic soil when highly sensitive, size-specific methods and rigorous quality controls are applied.
What the researchers sampled
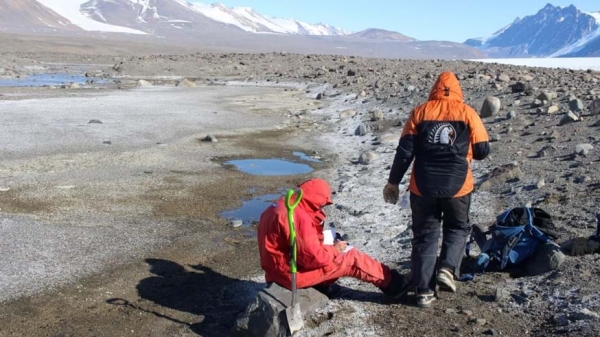
An international research team led by Lancaster University analysed soils collected from the Taylor and Wright Valleys within the McMurdo Dry Valleys.
Sampling took place from 8 to 28 January 2023 and included:
- Thirteen topsoil samples collected from depths of 0–10 centimetres
- Four subsurface or deeper-soil samples collected from depths exceeding 20 centimetres
- Samples from two valleys rather than the Antarctic continent as a whole
The study published in Scientific Reports examined both larger microplastics and nanoplastics.
For this research, microplastics were defined as particles between one micrometre and five millimetres. Nanoplastics were defined as particles smaller than one micrometre, with the analysed fraction covering approximately 20 nanometres to one micrometre.
A nanometre is one-billionth of a metre. At this scale, particles cannot be counted reliably using ordinary visual inspection or conventional environmental microscopy.
What the study found
Nanoplastics were detected above polymer-specific method detection limits at 54% of the 13 topsoil sites—equivalent to seven sites.
The reported topsoil concentrations ranged from below the relevant detection limits to 295 nanograms per gram of soil. The median concentration across the topsoil sites was 26.6 nanograms per gram.
Nanoplastics were also reported in two of the four deeper-soil samples, although the very small number of deeper samples limits the conclusions that can be drawn about vertical movement.
The analytical method targeted signals associated with:
- Polypropylene
- Polyethylene
- Polyethylene terephthalate
- Polystyrene
- Polyvinyl chloride
- Tyre-wear particles
Polypropylene contributed the largest proportion of the reported nanoplastic mass across the sampled locations, followed by tyre-wear particles and polyethylene. Composition varied considerably between samples.
The researchers also investigated larger microplastics. Only one of the 17 soil samples contained microplastic concentrations above the study’s method detection limits for the examined size thresholds.
This apparent difference between larger microplastics and nanoplastics is significant, but it requires careful interpretation. It may reflect transport and fragmentation processes, differences in particle distribution or major differences between the sensitivity and recovery of the two analytical methods.
How the nanoplastics were detected
The researchers developed a new extraction protocol for isolating nanoplastics from soil and combined it with thermal desorption–proton transfer reaction time-of-flight mass spectrometry, abbreviated as TD-PTR-TOF-MS.
The process involved:
- Digesting a soil subsample using hydrogen peroxide
- Separating suspended nanoscale material from heavier soil particles
- Passing the suspension through filters that isolated the target size fraction
- Heating the collected material to thermally desorb chemical compounds
- Analysing the resulting mass spectrum
- Comparing the spectral pattern with reference fingerprints for selected polymers
This is a mass-based analytical approach. It does not produce a visual count of every individual nanoparticle. Instead, it estimates the mass of targeted plastic categories within the isolated fraction using their thermal and mass-spectral fingerprints.
The technique made it possible to detect plastic-related material at nanogram levels—far below what routine visual microplastic methods can usually measure.
Why the results are described as semi-quantitative
The researchers explicitly describe their nanoplastic results as semi-quantitative lower-bound estimates.
Particle recovery during extraction and analysis was incomplete. Potential losses included:
- Nanoplastics becoming trapped in filters
- Particles adhering to glassware and filtration equipment
- Incomplete thermal desorption
- Incomplete ionisation within the analytical instrument
- Differences in recovery caused by particle size, surface charge and density
- Aggregation with soil minerals or organic matter
The paper reports a general quantification uncertainty of approximately 30%. It also notes that the efficiency of the thermal desorption and proton-transfer mass-spectrometry process was below 100%.
Consequently, the reported values represent material successfully recovered, thermally desorbed, ionised and identified through the selected reference fingerprints. They should not be treated as exact measurements of every nanoplastic particle originally present.
This does not invalidate the detections. It defines what the results can support.
The study provides evidence of occurrence and approximate mass within a specific analytical framework. It does not provide an exact total inventory of nanoplastics in the soil.
Quality control is central to nanoplastic analysis
Plastic contamination can be introduced during sampling, storage, transport and laboratory preparation.
Sources can include:
- Synthetic clothing
- Plastic sampling tools
- Storage containers
- Laboratory air
- Filters and tubing
- Contaminated water or reagents
- Previous samples analysed on the same equipment
The research team used extensive controls to reduce and quantify these risks. Equipment was cleaned, glassware and filters were heated before use, samples were prepared in a cleaned laminar-flow hood, and personnel wore cotton laboratory coats.
Procedural blanks followed the same extraction process as the samples. Instrument blanks were also analysed repeatedly to establish and correct background signals.
For each targeted polymer, the researchers calculated a method detection limit using the average procedural-blank result plus three standard deviations. Only sample concentrations exceeding the relevant limit were reported, after blank correction. Results below those limits were conservatively treated as zero.
This approach is essential because detecting a small signal is not sufficient. The signal must be distinguishable from contamination and analytical background.
Microplastic and nanoplastic methods are not interchangeable
The study used Nile Red staining and fluorescence microscopy for larger microplastics.
This method can help identify particle-like material, but it has important limitations:
- It cannot chemically confirm the polymer type.
- Some black, rigid or less hydrophobic plastic particles may not stain effectively.
- Residual natural organic matter can create false positives.
- Particles between one and ten micrometres were not included.
- The reported microplastic recovery rate was approximately 23%.
The nanoplastic method was more chemically specific for its targeted reference materials, but it also had incomplete recovery and could examine only the selected polymer categories.
An environmental report that states “no microplastics detected” may therefore mean several different things:
- No particles were present.
- Particles were present below the method detection limit.
- Particles were outside the examined size range.
- The polymer was not included in the analytical library.
- Extraction recovery was insufficient.
- The matrix interfered with detection.
Every reported result should therefore include its method, size range, recovery performance, detection limits and blank data.
Where did the Antarctic nanoplastics come from?
The researchers used the FLEXPART atmospheric particle-dispersion model to investigate potential transport pathways.
The modelling suggested that Antarctic summer deposition may be influenced more strongly by sources and particle redistribution within Antarctica. During other parts of the year, possible contributing regions included the Southern Ocean, New Zealand and the southern part of South America.
Potential local sources identified by the researchers included:
- Research stations
- Scientific equipment and infrastructure
- Clothing and outdoor equipment
- Tyre and rubber wear
- Wastewater and waste-management activities
- Tourism
- Resuspension of previously deposited particles
Possible longer-range pathways included atmospheric transport, ocean-to-atmosphere exchange and the release or redistribution of particles previously stored in snow or ice.
These are scientifically plausible pathways—not confirmed source assignments.
The model calculated how particles could reach the sampling region under different atmospheric conditions. It did not chemically match individual soil particles with a particular research station, country, vessel or waste source.
Direct atmospheric deposition monitoring, source sampling and repeated soil measurements would be required to strengthen source attribution.
Detection does not demonstrate ecological harm
The study analysed environmental occurrence. It did not expose Antarctic organisms to the measured soil concentrations, perform toxicity tests or demonstrate changes in soil communities.
Nanoplastics may behave differently from larger particles because of their:
- Greater surface-area-to-volume ratio
- Potential mobility through soil pores
- Ability to aggregate with natural particles
- Potential to adsorb or transport other chemicals
- Potential accessibility to microorganisms and small soil organisms
- Ability to release additives or degradation products
These properties create reasons for investigation, but they are not evidence that ecological injury occurred at the sampled sites.
The McMurdo Dry Valleys support microbial communities and small soil organisms adapted to extreme conditions. Researchers have raised concerns that slow growth, low metabolism and limited adaptability could make some polar organisms sensitive to additional stress.
However, environmentally relevant toxicity thresholds for different Antarctic soil organisms remain uncertain. Ecotoxicity research using the measured polymer types, size ranges and concentrations would be needed to evaluate actual risk.
The findings support stronger Antarctic monitoring
The discovery aligns with increasing international concern about plastic contamination in polar environments.
In 2025, the Antarctic Treaty Consultative Meeting adopted Resolution 5: Towards ending plastic pollution in the Antarctic Treaty area. It called for stronger monitoring of plastic pollution, its sources and its effects, using relevant standards and comparable methodologies.
That emphasis on comparative methods matters. Results from different studies cannot be combined reliably if they use incompatible:
- Particle definitions
- Size thresholds
- Sampling depths
- Extraction procedures
- Polymer-identification methods
- Reporting units
- Blank-correction approaches
- Detection limits
The Antarctic findings should therefore encourage both more monitoring and greater analytical harmonisation.
What does this mean for the Caribbean?
The study does not establish nanoplastic concentrations in Trinidad and Tobago or elsewhere in the Caribbean.
Antarctic soils are exceptionally cold, dry, coarse-textured and low in organic carbon. Tropical Caribbean soils may contain much higher levels of clay, organic material and biological activity and experience far more intense water movement.
These differences can affect:
- Particle retention
- Aggregation
- Vertical movement
- Extraction efficiency
- Organic-matter interference
- Degradation and weathering
- Biological exposure
A method validated for Antarctic soil cannot be applied to a tropical soil without additional matrix-specific recovery and interference testing.
Nevertheless, the research identifies an important regional monitoring question.
The Wider Caribbean already faces documented challenges involving land-based plastic waste and marine litter. UNEP’s Regional Action Plan for Marine Litter recognises the interconnected nature of plastic pollution and the need for coordinated national and regional action.
Potential Caribbean investigation areas could include soils and sediments near:
- Landfills and open waste-disposal areas
- Recycling and waste-processing facilities
- Heavily trafficked roads
- Industrial operations
- Wastewater-treatment systems
- Stormwater channels
- Agricultural land using plastic mulch, compost or biosolids
- Rivers and floodplains
- Coastal depositional environments
- Tourism and recreational facilities
These locations represent possible sources or accumulation zones. They should not be labelled as contaminated without site-specific evidence.
Designing a credible soil nanoplastic investigation
A nanoplastic monitoring programme must begin with a specific environmental question.
| Monitoring component | Purpose |
|---|---|
| Conceptual site model | Identifies possible sources, transport pathways and ecological receptors |
| Representative soil sampling | Captures spatial variability, depth and background conditions |
| Matrix characterization | Measures texture, organic carbon, pH and other factors affecting extraction and mobility |
| Defined size fractions | Separates microplastic and nanoplastic questions |
| Polymer-specific analysis | Identifies which targeted plastic materials are measurable |
| Field and laboratory blanks | Distinguishes environmental contamination from procedural contamination |
| Spike-and-recovery tests | Determines how much material the method loses in the actual soil matrix |
| Detection and quantification limits | Defines what “detected” and “not detected” mean |
| Replicate and reference samples | Helps distinguish hotspots from natural sampling variability |
| Ecological assessment | Evaluates whether occurrence creates a plausible exposure or risk |
The sampling plan should minimize plastic contact wherever practicable and document unavoidable plastic components. Containers, clothing, filters, equipment and airborne contamination must all be considered.
Advanced laboratory analysis should be selected according to the target particle size and reporting objective. No single technique currently answers every microplastic and nanoplastic question.
How Ecotox can support evidence-based investigations
Ecotox Environmental Services can support the development of defensible plastic-contamination investigations through:
- Soil and sediment sampling
- Specialized environmental sampling
- Environmental analytical-testing programmes
- Waste characterization
- Stormwater and wastewater sampling
- Riverine and marine sampling
- Environmental baseline studies
- Emerging-contaminant investigations
- Ecological risk assessment
- Environmental impact assessment
- Environmental compliance monitoring
Where nanoplastic analysis requires specialized instrumentation, the programme should establish the analytical laboratory, matrix-specific recovery tests, reporting limits, contamination-control requirements and data-quality objectives before samples are collected.
Learn more about Ecotox’s environmental analytical testing services.
What we cannot see still requires measurement
The Antarctic study demonstrates both the global reach of plastic contamination and the analytical difficulty of measuring it.
Nanoplastics were detected in selected topsoil and deeper-soil samples, but the results remain limited to two valleys, a modest number of samples, one sampling period and six targeted material categories.
Possible transport pathways were identified, but individual sources were not proven. Environmental occurrence was established, but ecological damage was not.
Those limitations do not weaken the study’s central lesson. They make it more useful.
Environmental conclusions are only as defensible as the sampling design, analytical method, recovery data, detection limits and contamination controls behind them. When pollutants become smaller than ordinary methods can see, advanced environmental testing is not optional—it defines what evidence can exist.
Sources
- Le, Q. N. P., et al. First evidence of nanoplastics in Antarctica soil. Scientific Reports, 2026.
- Lancaster University. Nanoplastics found in Antarctic soils for the first time
- Antarctic Treaty Secretariat. Resolution 5 (2025): Towards ending plastic pollution in the Antarctic Treaty area
- International Organization for Standardization. ISO 24187: Principles for the analysis of microplastics present in the environment
- United Nations Environment Programme. Solid Waste and Marine Litter in the Wider Caribbean