


The 2026 Ozone Update and Why Different Air Measurements Answer Different Questions
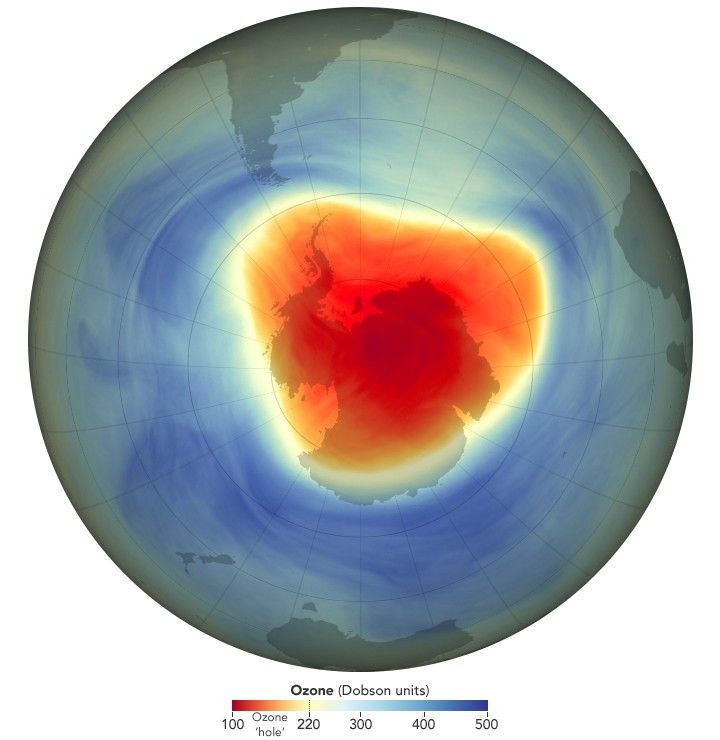
Ozone monitoring answers different questions depending on where the measurement takes place and what it represents. The November 2026 Antarctic update concerns the protective ozone layer high in the atmosphere. Businesses in Trinidad and Tobago, Guyana, Suriname and the wider Caribbean need to distinguish that global finding from measurements of the air around a workplace or community.
Imagine a manager reading an ozone-hole headline before receiving a local air-quality report. Both documents mention ozone, yet they concern different places, methods and decisions. Comparing their numbers directly would create confusion rather than explain conditions at the site.
The useful business lesson is to define the question before interpreting the result. A sound air-monitoring brief identifies the pollutant, location, period and purpose. It also explains which conclusions the evidence can support.
What the 2026 ozone monitoring update reports
On 4 November, NOAA and NASA reported that the 2026 Antarctic ozone hole ranked seventh-largest in 48 years by seasonal mean area. They linked the unusually large extent to a strong polar vortex. Nevertheless, the agencies said long-term recovery of the protective ozone layer remained on track.
During the peak season from 7 September to 13 October, its average area was about 25 million square kilometres. The daily maximum reached 27.1 million square kilometres on 18 September. These measures describe the Antarctic phenomenon, rather than pollutant concentrations at a Caribbean workplace.
Preserve the measure behind the headline
A seasonal average and a daily maximum describe different summaries. They can both be accurate without representing the same observation. Therefore, keep the period and definition beside any figure used in a presentation or article.
The same discipline applies to local monitoring. Before discussing an apparent change, check whether the two results cover comparable periods. A difference in reporting format can otherwise look like a difference in air quality.
Stratospheric and ground-level ozone monitoring
Ozone high in the stratosphere helps protect life from harmful ultraviolet radiation. At ground level, ozone is an air pollutant with a different environmental and health significance. The location of the gas is central to understanding the issue.
Consequently, a recovery finding about the upper atmosphere should not become a claim that local breathing-zone conditions improved. Likewise, a local ozone measurement does not describe the entire protective ozone layer. The project needs to retain the scale of the original observation.
Check the units in ozone monitoring
NOAA's annual update includes a minimum overhead ozone value of 105 Dobson units over the South Pole on 17 October. Dobson units describe a column of atmospheric ozone. That value should not be read as a workplace air concentration.
An air-quality report should identify its own units and method. If a reader cannot tell what a number represents, the team should seek clarification. Converting the appearance of a chart cannot resolve a difference in what the instruments measured.
How ground-level ozone forms
The US EPA explains that ground-level ozone forms through reactions involving nitrogen oxides and volatile organic compounds in sunlight. It is therefore different from a pollutant that a source simply releases in its final form. Weather and atmospheric processes matter to the resulting pattern.
EPA also notes that wind can transport ozone, affecting areas away from precursor sources. A rural location should not automatically be treated as a place where ozone cannot occur. However, this general mechanism does not establish a measured condition at any named Caribbean site.
Explain the mechanism without inventing local findings
A business can use this scientific context to plan a suitable investigation. It still needs relevant evidence before describing the concentration at its own location. The distinction matters when a report will inform management, customers or the public.
For example, nearby traffic or industry may form part of a survey's context. Their presence alone does not quantify a site's ozone concentration or establish responsibility for a finding. The investigation should remain clear about observation and interpretation.
Define the ozone monitoring decision
A project may concern ambient conditions, an indoor question or a particular work activity. Those purposes need different survey arrangements. The initial brief should identify the people, place and decision relevant to the assignment.
For instance, a community-oriented outdoor survey should explain the area and period it intends to represent. An indoor investigation should identify the rooms, activities and operating conditions under review. Using the same pollutant name does not make those designs interchangeable.
Ask what the result will change
The organisation may need to plan further investigation, review a process or assess a proposed control. State the intended response before selecting measurements. This helps the technical team identify information that would be useful.
It also prevents a broad request to test everything from replacing a defined purpose. Different parameters can answer different questions. A clear scope makes the final report more understandable and the next decision easier to assign.
Ozone monitoring is different from particle monitoring
A particle instrument and an ozone instrument measure different properties. A particulate reading should not become an ozone result simply because both appear in an air-quality dashboard. Check the parameter and method associated with each display.
Similarly, a general air-quality label can conceal a narrow measurement scope. The team should establish which pollutants the report actually includes. This is useful when comparing quotations, instruments or information supplied by different providers.
Read the ozone monitoring parameter list
A report may include particles, selected gases or other environmental information. Each result should keep its own identity and units. An overall statement should explain which evidence supports it.
For example, a low value for one measured parameter does not establish that every air pollutant is low. The result can still be useful within its scope. Clear wording protects that value without turning it into an unsupported general conclusion.
Location choices in ozone monitoring
Choose monitoring positions that match the question. Record where the instrument operated and why that location was selected. In addition, identify practical features that may affect how the results should be interpreted.
A monitor beside an unusual activity may serve a focused investigation. Another position may serve a broader site question. The report should explain that distinction before describing either reading as representative of the entire property.
Keep a location record that can be repeated
A site sketch, location identifier and relevant photographs can support future work. Note any important changes when the team returns. A moved instrument should not silently become an exact repeat of the earlier position.
This matters when a company compares conditions before and after a change. If the instrument location also changes, the comparison needs that context. The project should not attribute the entire difference to the intervention without reviewing it.
The time basis of ozone monitoring results
A short observation, an hourly summary and a longer average describe different periods. Keep the time basis visible wherever a result appears. A management chart should preserve that information alongside the concentration and unit.
The monitoring plan should also explain the coverage achieved. An afternoon survey cannot automatically describe every hour of the year. The conclusion should reflect the actual observation period and any important gaps.
A simple example of averaging
Suppose a hypothetical dataset contains four equally weighted readings of 10, 10, 10 and 50 in a stated unit. Their arithmetic mean is 20, while the maximum is 50. The two summaries answer different questions about the same invented dataset.
These numbers are a mathematical illustration, not ozone measurements, safety limits or a recommended averaging method. A real monitoring programme needs an appropriate method and interpretation. The example simply shows why a maximum should not be compared casually with an average.
Weather adds context to ozone monitoring
The formation and movement of ground-level ozone involve atmospheric conditions. A local project should therefore consider which weather observations are relevant to its design. The technical team can identify the appropriate information for that assignment.
Record the monitoring dates and relevant conditions without treating weather as an automatic explanation for every result. An interpretation should connect the observations with a clear basis. Where the available information cannot resolve a question, state the limitation.
Align ozone monitoring and weather records
If the team reviews monitoring and weather records together, their times should be unambiguous. Identify the time zone and the period represented. This avoids a simple timing mismatch becoming a misleading comparison.
For a regional business exchanging information with overseas specialists, that detail is particularly practical. The raw data and management summary should refer to the same periods. A consistent time record helps reviewers understand the event being discussed.
Instrument quality and usable results
Before fieldwork, confirm that the proposed instrument and method suit the parameter and purpose. Discuss relevant checks, reporting capability and the way the provider will handle questionable data. These questions belong in the scope rather than appearing only after the report arrives.
The report should identify important limitations. A numerical value may look precise on a screen while still requiring context about the measurement. The organisation needs to understand the provider's interpretation before using the result in a wider claim.
Document gaps in ozone monitoring
If an instrument was unavailable or a period did not produce usable data, document the gap. Do not silently fill it with an assumed value and present the series as entirely observed. Any estimation should remain clearly identified.
The management summary can then explain how the gap affects the conclusion. A short interruption may have a different implication from missing the period relevant to the main question. The technical reviewer should make that distinction explicit.
Indoor investigations need their own scope
An indoor air enquiry should describe the rooms, occupancy and activities that prompted it. The brief can identify relevant equipment, ventilation arrangements and the timing of the concern. However, those observations do not establish a pollutant concentration before measurement.
The provider should confirm which parameters address the question and how it will interpret them. A broad indoor-air checklist may be useful for one assignment and unsuitable for another. Keep the investigation connected to the actual workplace.
Environmental results and individual symptoms differ
An environmental survey describes the conditions within its measurement scope. It should not claim to diagnose an individual worker's illness. Personal health concerns need appropriate medical attention through a separate process.
Similarly, a report should avoid including identifiable medical information that the environmental assignment does not need. The manager can describe the operational concern while protecting confidentiality. Clear responsibilities help both the monitoring and health processes work properly.
Ozone monitoring in Trinidad and Tobago
Consider a hypothetical Trinidad operator planning an outdoor air survey around a facility. The brief could identify the monitoring boundary, relevant activities and the decisions the information will support. The provider can then advise on suitable parameters, methods and observation periods.
A hypothetical Tobago hospitality business with an indoor enquiry faces a different assignment. Its room use and operating conditions matter to the scope. Neither scenario can use an Antarctic ozone-hole graphic as evidence of conditions at the property.
Connect air monitoring with site information
The business can prepare a simple map, an activity schedule and any relevant existing reports. In addition, identify who can explain unusual operating events. These records help the provider interpret measurements in their actual setting.
After the survey, management should receive a clear account of what the results represent. Ask the provider to explain the next action where further investigation is appropriate. This makes the report useful beyond its initial delivery.
Applying the approach in Guyana and Suriname
A hypothetical project in Guyana may need environmental information for planning before an operation begins. A baseline should state its period and conditions clearly. It does not promise that future operating conditions will remain identical.
A hypothetical Suriname operation reviewing an indoor process may instead need measurements tied to particular work periods. Its monitoring design should follow that activity. A regional template can support consistent records while allowing the technical scope to differ.
Keep requirements specific to the project
The provider and operator should identify applicable local requirements and any relevant project conditions. An overseas technical explanation does not automatically establish a legal limit in either country. The report needs a clear basis for any comparison it makes.
Likewise, a value from a different monitoring context should retain its purpose. A local compliance question may require a different period or method from a general research illustration. Confirm the intended use before presenting a conclusion.
Wider Caribbean organisations need clear comparisons
A business with several locations may want a regional overview. Begin with consistent parameter names, units and time definitions. Then identify which sites and datasets are suitable for comparison.
Two reports can use the same pollutant name while covering different activities and observation periods. A simple ranking may therefore conceal important differences. The overview should explain the basis of the comparison rather than rely on colour-coded values alone.
Use dashboards as summaries of evidence
A dashboard can make findings easier to review when it retains access to their context. Display the parameter, location and relevant period. In addition, distinguish observed information from estimates or incomplete coverage.
The underlying report should remain available to the responsible reviewer. This allows management to act on a finding without losing the explanation behind it. A clear display supports a good monitoring programme; it does not replace one.
Communicating ozone monitoring findings responsibly
A useful public statement describes what the organisation measured and where. It should also identify the period and any material limitation. Readers can then understand the difference between a site observation and a wider environmental claim.
Avoid using one favourable parameter to describe all air quality as safe. Similarly, an unexpected value needs interpretation before it becomes an accusation about a neighbouring source. Keep the wording proportionate to the evidence available.
Preserve the context of the illustration
The image accompanying this article is a historical NASA illustration from September 2024. It is not the 2026 observation and does not show Caribbean ground-level air quality. Its date and attribution appear in the Sources section.
A business should apply the same care to its own graphics. Match the image, caption and date to the claim being discussed. An attractive visual should clarify the information rather than create a stronger conclusion than the data supports.
What ECOTOX services can contribute
ECOTOX publishes ambient and indoor air-quality monitoring services serving Trinidad and Tobago, Guyana, Suriname and the wider Caribbean. Its air-quality page also describes the use of meteorological information alongside monitoring. These services provide a relevant starting point for a defined local investigation.
The company's occupational monitoring page specifically lists ozone among indoor chemical parameters. Confirm the proposed ozone method, measurement range, survey design and interpretation for the particular project. A published service category is a starting point for scoping the work.
Prepare a useful ozone monitoring enquiry
Describe the site, activity, concern and intended decision. Include working hours, relevant locations and any existing reports. The team can then clarify whether the question concerns ambient monitoring, indoor conditions or another specialist assignment.
Explore ECOTOX air-quality monitoring services and occupational monitoring services to discuss that scope. For Caribbean businesses, useful ozone monitoring starts with a clearly defined question and ends with an interpretation that preserves what the measurements actually show.
Sources
- NOAA and NASA measurements of the 2026 ozone hole. 4 November 2026.
- US EPA Ground-level Ozone Basics. Updated 18 February 2026.
- ECOTOX ambient air quality monitoring. Accessed 20 November 2026.
- ECOTOX occupational monitoring services. Accessed 20 November 2026.
Image credit: NASA Earth Observatory image by Lauren Dauphin using NASA Ozone Watch and GEOS-5 data. Ozone Hole Continues Healing in 2024. Public domain NASA work. Historical reference illustration from 28 September 2024. This is not the 2026 ozone observation. Downloaded without edits; scaled only for display.
