


Microplastics in Rivers: Why High Water Flows Can Change Pollution Levels
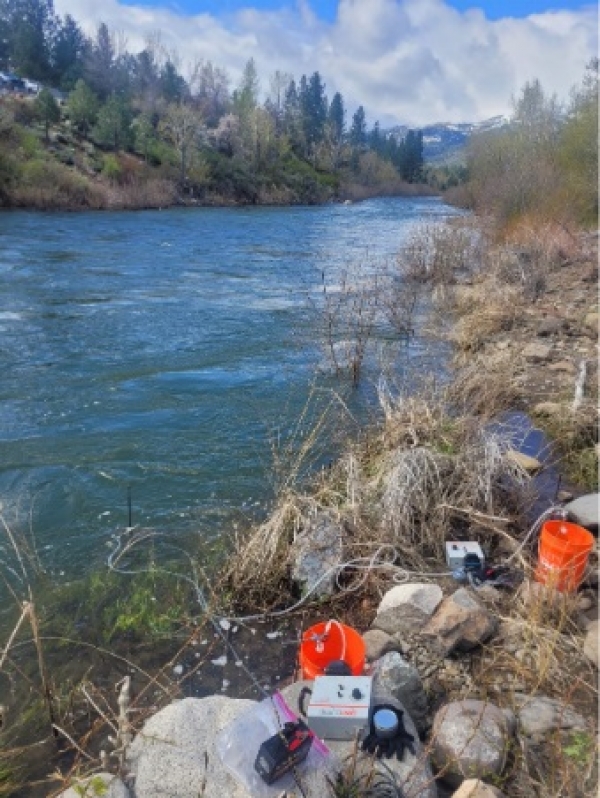
A river may contain substantially different concentrations of microplastics depending on when its water is sampled.
New research from the Desert Research Institute (DRI) in the United States demonstrates how seasonal changes in river flow can influence the occurrence and movement of plastic particles in freshwater environments.
Published in September 2026 in ACS ES&T Water, the study examined microplastic concentrations in Nevada’s Truckee River during low-flow autumn conditions and high-flow spring conditions.
The researchers found that average concentrations increased from approximately 0.4 microplastic particles per litre in autumn 2022 to 3.7 particles per litre in spring 2023.
That represents a difference of approximately 9.25 times between the reported seasonal averages.
The findings suggest that higher river discharge may mobilise plastic particles from surrounding land, riverbanks and previously deposited sediments.
However, they also raise a broader question for environmental professionals:
If river pollution changes with rainfall, runoff and discharge, can a single sampling exercise adequately represent the conditions that environmental managers need to understand?
For Trinidad and Tobago and the wider Caribbean, the research highlights the potential value of flow-aware monitoring programmes that consider changing hydrological conditions rather than relying exclusively on sampling at fixed calendar intervals.
What are microplastics, and why are rivers important?
Microplastics are small plastic particles generally defined as being smaller than five millimetres.
They can originate from the fragmentation of larger plastic products or from materials released into the environment in smaller forms.
Potential sources include:
- Fragmented plastic packaging and litter
- Synthetic textiles and fibres
- Some industrial plastic materials
- Wear and deterioration of polymer-based products
- Improperly managed waste
- Plastic-containing particles transported through drainage and wastewater systems
The composition, shape and size of these particles vary considerably.
Microplastics may occur as fragments, fibres, films or other forms.
Their environmental behaviour depends on characteristics such as polymer density, particle dimensions, surface properties and the movement of surrounding water.
Rivers are particularly important because they connect urban, agricultural and natural landscapes with downstream lakes, reservoirs, wetlands and coastal environments.
Plastic debris entering a river may be transported downstream, become trapped in vegetation, settle into sediment or accumulate temporarily along banks.
Changes in river flow can subsequently alter these processes.
Understanding microplastics in rivers therefore involves more than measuring whether particles are present.
It also requires investigating how they move and how their distribution changes through time.
What did the Truckee River study investigate?
The research was led by Hannah Lukasik, with Rachel Kozloski, Marin Monteith and Monica M. Arienzo of the Desert Research Institute.
The paper, titled Large Seasonal Variation in Microplastic Concentration from the Truckee River, United States, was published on September 15, 2026.
The Truckee River originates in the Lake Tahoe region and flows through communities including Reno and Sparks, Nevada, before reaching Pyramid Lake.
The river is important for water supply, recreation and aquatic ecosystems.
Researchers sought to understand how microplastic concentrations and polymer composition varied across the river system under different seasonal flow conditions.
Sampling periods
Samples were collected during two distinct periods:
Autumn 2022: Six locations were sampled during relatively low river-flow conditions.
Spring 2023: Eight locations were sampled during higher-flow conditions associated with seasonal snowmelt.
The investigators selected locations across different parts of the watershed, including areas influenced by changing land use and human activity.
This approach provided an opportunity to examine differences in particle concentrations and environmental characteristics along the river.
However, the study involved two sampling periods rather than a continuous multi-year monitoring programme.
Consequently, its results should be interpreted as evidence of differences between those sampled conditions, rather than a complete description of long-term annual variability.
How were microplastics collected and identified?
The researchers used a field-deployable peristaltic pump to collect river surface-water samples.
The water passed through a filter with an approximate pore size of 100 micrometres.
Particles retained on the filters were subsequently examined using laboratory techniques.
Fourier-transform infrared spectroscopy
The study used microscope-enabled Fourier-transform infrared spectroscopy, commonly abbreviated as micro-FTIR or µFTIR.
The technique measures how a material interacts with infrared radiation.
Different polymers have characteristic infrared spectral patterns.
By comparing a particle’s measured spectrum with reference spectra, analysts can identify candidate polymer materials.
This is important because particles resembling plastic under a microscope may actually consist of natural or other non-plastic materials.
Microscopy alone is therefore not always sufficient for reliable polymer identification.
Particle characterisation
The researchers classified recovered particles using information including:
- Particle dimensions
- Morphology
- Colour
- Infrared spectral characteristics
- Identified polymer type
The publicly available research dataset includes individual particle classifications and information about the filters analysed.
Quality assurance and contamination controls
Microplastic analysis presents particular challenges because airborne fibres and laboratory materials can introduce contamination during sampling and processing.
The researchers documented several control measures.
Their published dataset describes four field blanks and two laboratory blanks.
Blank samples were processed to help estimate background contamination.
The investigators used a minimum-detectable-amount approach to adjust results for relevant blank detections.
The dataset also documents particle preparation, spectral identification and whether all particles or a selected subset were analysed by FTIR.
These procedures strengthen the transparency of the research.
However, the existence of these controls does not mean that every possible sampling bias or analytical uncertainty was eliminated.
An important limitation is the 100 µm filtration threshold.
Particles substantially smaller than this size were not comprehensively represented.
The reported concentrations must therefore not be interpreted as the total abundance of every microplastic and nanoplastic particle present in the river.
What did the study find?
The most prominent result was the difference in microplastic concentration between the two sampling seasons.
| Sampling condition | Mean microplastic concentration |
|---|---|
| Autumn 2022 — lower flow | 0.4 particles/L |
| Spring 2023 — higher flow | 3.7 particles/L |
The reported seasonal means differed by approximately a factor of 9.25.
The researchers found that the difference between the sampling periods was statistically significant.
The results also showed substantial variation among individual sampling locations.
During spring, concentrations ranged from approximately 1.0 to 10.0 particles per litre at the sampled sites.
One urban location within Reno exhibited particularly high concentrations.
These patterns demonstrate that microplastic measurements can vary both geographically and temporally.
They also highlight why one sampling result should not automatically be treated as representative of an entire river system.
Why were concentrations higher during spring?
The researchers identified river discharge as an important factor associated with the seasonal change.
During higher flows, several environmental processes may influence particle transport.
Surface runoff from surrounding land
Rainfall and snowmelt can carry material from roads, developed areas and other parts of a watershed into drainage systems and rivers.
Where microplastics are present on the landscape, runoff provides a possible transport pathway.
Resuspension from riverbed sediments
Particles may settle or become trapped in sediments during relatively low-flow conditions.
Changes in water velocity and turbulence can subsequently disturb some deposited material.
The resulting particles may re-enter the water column.
Erosion of riverbanks
Higher flows may erode banks and mobilise particles that have accumulated in adjacent material.
The quantity mobilised depends on local river conditions and the properties of the deposited particles.
Changing contributions from tributaries and drains
Increased water flow can alter the relative contributions of tributaries, stormwater drains and other inputs.
However, the significance of each input must be established through appropriate monitoring.
These mechanisms provide plausible explanations for the Truckee River findings.
The study supports the importance of hydrological conditions but does not definitively apportion the measured particles among every possible source.
What kinds of plastic were detected?
The researchers identified several polymer types.
Among the most important overall were:
Polypropylene (PP): Used in packaging, containers and many industrial or household products.
Polyethylene (PE): Commonly used in plastic bags, films, containers and other products.
Polyethylene terephthalate (PET): Used in beverage packaging, fibres and other applications.
The study also reported seasonal differences involving rubber-associated particles.
PET, polyethylene and rubber concentrations increased during the spring sampling period.
These findings are consistent with the possibility that changing hydrological conditions mobilise particles from different environmental reservoirs.
However, polymer composition alone does not establish the exact source of the particles.
A polyethylene fragment could originate from more than one type of product.
Rubber-associated particles may similarly have multiple possible origins.
Identifying a particular source would require additional evidence, potentially including more detailed chemical characterisation, environmental source inventories, spatial monitoring and transport analysis.
What did the study find about land use?
The researchers compared microplastic concentrations with characteristics of the surrounding watershed.
During spring, they identified positive relationships between measured concentrations and some measures of developed land upstream.
This suggests that nearby developed areas may contribute to riverine microplastic contamination.
However, an important qualification appears in the study.
The reported land-use relationships were strongly influenced by elevated concentrations at one sampling location.
Consequently, the results do not establish that a particular category of development caused the concentrations measured throughout the watershed.
The study also did not find equivalent statistically significant land-cover relationships during autumn.
These observations reinforce the importance of considering both land use and hydrological conditions during environmental interpretation.
Why concentration and pollutant load are different
Environmental monitoring often distinguishes between the concentration of a substance and the total amount transported over time.
Concentration describes how much of a substance or how many particles occur within a defined volume of water.
For microplastics, this may be expressed as particles per litre.
Particle load or flux describes how many particles move through a river cross-section over a period of time.
It can be expressed as particles per second.
This distinction matters because a river can transport a much greater total quantity of particles during high-flow conditions.
Even where concentrations remain unchanged, increasing the volume of water moving downstream can increase the number of particles transported.
The Truckee River researchers estimated substantially higher particle loads during spring than in autumn.
However, their calculations assumed that concentrations measured near the surface represented conditions across the river.
Because particles may be distributed unevenly through the water column and across a river’s width, these load estimates require caution.
A more comprehensive transport study may need depth-integrated or cross-sectional sampling, combined with river-discharge measurements.
A concentration measurement alone does not establish the total quantity of microplastics transported downstream.
Does finding microplastics demonstrate ecological or human harm?
No.
The detection of microplastics establishes their presence within the analytical limits of the method used.
It does not independently demonstrate that the measured concentrations caused adverse health effects.
Potential environmental risks depend on several factors, including:
- Particle size and shape
- Polymer composition
- Chemical additives and associated contaminants
- Exposure duration
- Biological uptake
- Species and life-stage sensitivity
- Environmental concentration
- Interaction with other stressors
The World Health Organization has identified substantial evidence gaps concerning the occurrence of microplastics in water, analytical comparability and potential health impacts.
The Truckee River study investigated environmental concentrations, polymer composition and transport patterns.
It was not designed to establish whether the observed concentrations caused disease, toxicity or ecological damage.
Likewise, the fact that the river is used as a drinking-water source does not establish the concentration of microplastics in treated drinking water.
Source-water contamination, treatment performance and finished drinking-water quality require separate assessments.
Why a single sampling event may be misleading
A water sample represents environmental conditions at a particular location and time.
That measurement can be scientifically valid without necessarily representing the full range of conditions experienced by the waterbody.
For example, a river sampled during low flow may contain relatively few suspended microplastic particles.
A subsequent high-flow event may transport additional particles from the surrounding catchment or riverbed.
Sampling only during the low-flow period could therefore underestimate concentrations during higher-flow conditions.
Conversely, a sample collected during an unusual event may not represent typical background conditions.
The appropriate monitoring strategy depends on the question being investigated.
For some objectives, periodic sampling may be sufficient.
For others, it may be important to include different seasons, rainfall conditions or flow events.
The Truckee River findings support the value of carefully considering when and where samples are collected.
What does this mean for Trinidad and Tobago and the Caribbean?
Caribbean rivers differ substantially from the Truckee River.
Rather than being primarily influenced by Sierra Nevada snowmelt, many Caribbean watersheds respond to tropical rainfall and seasonal changes in precipitation.
Trinidad and Tobago experiences distinct wet and dry periods, and some catchments may respond rapidly to intense rainfall.
These characteristics create legitimate questions about the movement of plastic debris, suspended sediments and associated contaminants.
Rainfall and stormwater
High-intensity rainfall can increase runoff from developed areas.
Where plastic particles are present on roads, exposed soil, drainage channels or other surfaces, stormwater may provide a pathway into receiving waters.
However, the presence and magnitude of microplastic contamination must be demonstrated through appropriate local sampling.
Short watershed-to-coast connections
Some Caribbean watersheds have relatively short transport pathways from inland drainage systems to estuaries, wetlands or coastal environments.
This creates a potential connection between land-based sources and downstream receiving environments.
The actual transport of particles depends on local hydrology, sedimentation, retention and other environmental conditions.
Rivers near developed areas
Urbanisation, infrastructure, wastewater systems and land-use patterns may influence the types of materials entering drainage networks.
A source-investigation programme could examine changes in microplastic concentrations upstream and downstream of relevant activities.
However, higher concentrations at a downstream location would not automatically prove that a particular facility caused the increase.
Reference monitoring and additional source evidence would be necessary.
Seasonal monitoring
The strongest practical lesson for the Caribbean is that dry-season sampling alone may not answer every question about contaminant movement.
A scientifically justified investigation could compare measurements during representative low-flow and high-flow conditions.
Where appropriate, event-based sampling following rainfall may provide additional information.
The observed Nevada concentrations should not be used as Caribbean background levels, exposure thresholds or predictions.
What would a defensible Caribbean microplastic monitoring programme look like?
A structured programme should begin with clearly defined objectives.
Step 1: Establish the monitoring question
Determine whether the investigation seeks to establish baseline concentrations, evaluate seasonal variation, identify possible sources or estimate downstream particle transport.
These objectives require different sampling designs.
Step 2: Develop a conceptual watershed model
Review land use, known drainage inputs, river flow patterns, wastewater infrastructure and possible particle accumulation zones.
Identify potential sources and transport pathways without assuming contamination has been demonstrated.
Step 3: Select representative sampling locations
Depending on the study objectives, locations may include:
- Upstream reference sites
- Urban river sections
- Downstream receiving waters
- Locations near drainage inputs
- Estuarine or coastal transition areas
Site selection should consider access, mixing conditions and hydraulic variability.
Step 4: Account for seasonal and event-related changes
Select sampling periods that address the environmental questions.
For example, a project may include dry-season baseline measurements and wet-season measurements under defined flow conditions.
Where justified, event-based sampling may be added.
One rainfall event should not be treated as representative of all wet-season conditions.
Step 5: Select appropriate sampling and analytical methods
The chosen method should specify the target particle-size range, sampling volume, filtration requirements and laboratory identification technique.
Different filter sizes and analytical methods may produce different particle counts.
Results from studies using different methods should not be compared without evaluating their methodological compatibility.
Step 6: Establish contamination controls
Microplastic investigation is particularly vulnerable to contamination during collection and analysis.
A defensible programme may require:
- Appropriate sampling materials and cleaned equipment
- Field and laboratory blanks
- Documented sample storage and handling
- Contamination-control procedures
- Positive identification of polymer materials
- Detection and reporting criteria
- Relevant recovery checks
- Documented analytical uncertainty
The exact quality-control programme should be adapted to the selected method.
Step 7: Measure environmental conditions
Where possible, record relevant variables such as river discharge, water level, temperature, turbidity and recent rainfall.
These measurements can support interpretation of differences between samples.
Step 8: Interpret the findings conservatively
Distinguish measured particle concentrations from estimated particle loads.
Avoid assigning individual polymers to particular sources without supporting evidence.
Explain limitations arising from particle-size detection, sampling frequency, sample representativeness and analytical uncertainty.
Step 9: Develop evidence-based follow-up
If the findings identify areas or periods requiring closer investigation, additional monitoring can be designed to answer those questions.
The objective should be to improve environmental understanding rather than merely produce more measurements.
The role of environmental monitoring and regulatory assessment
Trinidad and Tobago’s Environmental Management Authority administers the Water Pollution Rules, 2019.
The rules establish a framework for regulating specified water-pollution discharges and addressing watershed management.
Environmental monitoring associated with regulated activities must consider the applicable standards, permit conditions and analytical requirements.
However, the Truckee River microplastic measurements should not be interpreted as exceedances of Trinidad and Tobago’s regulatory standards.
The research reports particle counts using a specified method, not locally adopted compliance thresholds.
Microplastic investigations may therefore be undertaken for baseline assessment, research, environmental management or source investigation without implying that a detected concentration automatically constitutes a regulatory violation.
How Ecotox can support freshwater monitoring investigations
Ecotox Environmental Services Limited provides environmental sampling, analytical testing and monitoring services relevant to riverine and watershed investigations.
Its published capabilities include:
- Riverine water sampling
- Stormwater sampling
- Wastewater and effluent sampling
- Marine-water and sediment sampling
- Environmental monitoring programme design
- Analysis of conventional water-quality parameters
- Environmental sampling and quality-assurance support
These capabilities can support investigations where contaminant transport, watershed conditions and environmental quality need to be characterised.
For microplastics specifically, the project scope should address the need for polymer-confirmation techniques such as micro-FTIR or Raman spectroscopy.
Such specialised analysis should only be described as an Ecotox in-house capability if the required instrumentation, methods and validation have been confirmed.
Where appropriate, Ecotox can support the sampling strategy, environmental measurements, data-quality objectives, specialist laboratory selection and interpretation of the resulting information.
Explore Ecotox Specialized Sampling Services.
Conclusion: River monitoring must account for changing environmental conditions
The 2026 Desert Research Institute study provides evidence that microplastic concentrations in the Truckee River differed dramatically between the sampled low-flow and high-flow conditions.
The reported mean concentrations increased from 0.4 to 3.7 particles per litre.
The findings are consistent with increased particle movement during high-flow conditions, potentially involving runoff, sediment resuspension and other watershed processes.
However, the study does not establish a universal seasonal pattern or demonstrate that the detected concentrations caused environmental harm.
For Trinidad and Tobago and the Caribbean, the most important lesson is methodological.
A reliable freshwater monitoring programme must consider whether its sampling design captures the environmental conditions most relevant to the investigation.
By incorporating appropriate seasonal coverage, hydrological information, source investigation and laboratory quality assurance, environmental professionals can produce data that better support decisions about freshwater protection and pollutant management.
Sources
- Lukasik, H., Kozloski, R., Monteith, M., & Arienzo, M. M. (2026). Large Seasonal Variation in Microplastic Concentration from the Truckee River, United States. ACS ES&T Water. https://doi.org/10.1021/acsestwater.6c00609
- Desert Research Institute. (September 21, 2026). Microplastics concentrations in the Truckee River surge during high spring flows, new study finds. https://www.dri.edu/microplastics-concentrations-in-the-truckee-river/
- Lukasik, H., Kozloski, R., Monteith, M., & Arienzo, M. (2026). Large seasonal variation in microplastic concentration from the Truckee River, United States [Dataset]. Dryad. https://doi.org/10.5061/dryad.66t1g1kg4
- World Health Organization. (2019). Microplastics in drinking-water. https://www.who.int/publications/i/item/9789241516198
- United States Environmental Protection Agency. (2023). Assessing Methods of Measuring Microplastics in Water. https://www.epa.gov/sciencematters/assessing-methods-measuring-microplastics-water
- Environmental Management Authority, Trinidad and Tobago. The Water Pollution Rules, 2019. https://www.ema.co.tt/our-environment/water/
- Ecotox Environmental Services Limited. Specialized Sampling Services. https://ecotoxes.ani.quest/services/complete_sampling_services/
- Ecotox Environmental Services Limited. Environmental Analytical Testing. https://ecotoxes.ani.quest/services/environmental_analytical_testing/